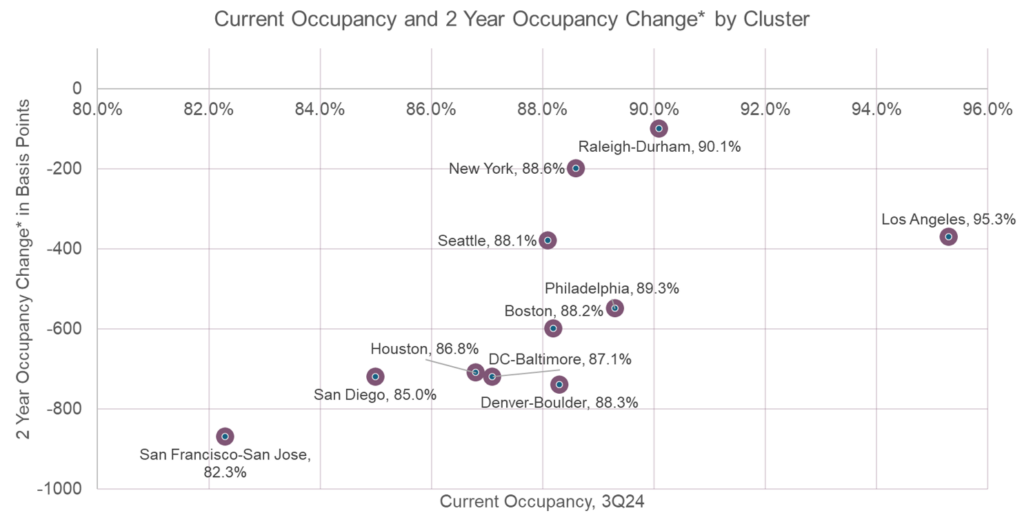
Revista tracks life science properties across the entire U.S. and virtually every area has felt an impact from reduced space demand combined with overbuilding. That being said, not every life science cluster felt these impacts to the same degree. In the chart below, each of the largest cluster areas are plotted according to their current occupancy and how much that occupancy has changed over the last 2 years (in basis points). To the right and top of the chart are metros with higher occupancy and less occupancy loss, and to the left and lower end of the chart are metros that have lower occupancy and more occupancy loss. The San Francisco/San Jose cluster has seen the most precipitous drop over the last 2 years losing 870 basis points (bps) since 3Q22. On the other end of the spectrum, Raleigh-Durham has only lost 100 bps in that period and 3Q24 occupancy is actually up sequentially since last quarter. Despite seeing the highest levels of construction, Boston has a higher occupancy and less deterioration than both major California markets. Join us for our 3Q24 Life Science Webcast to find out more!


