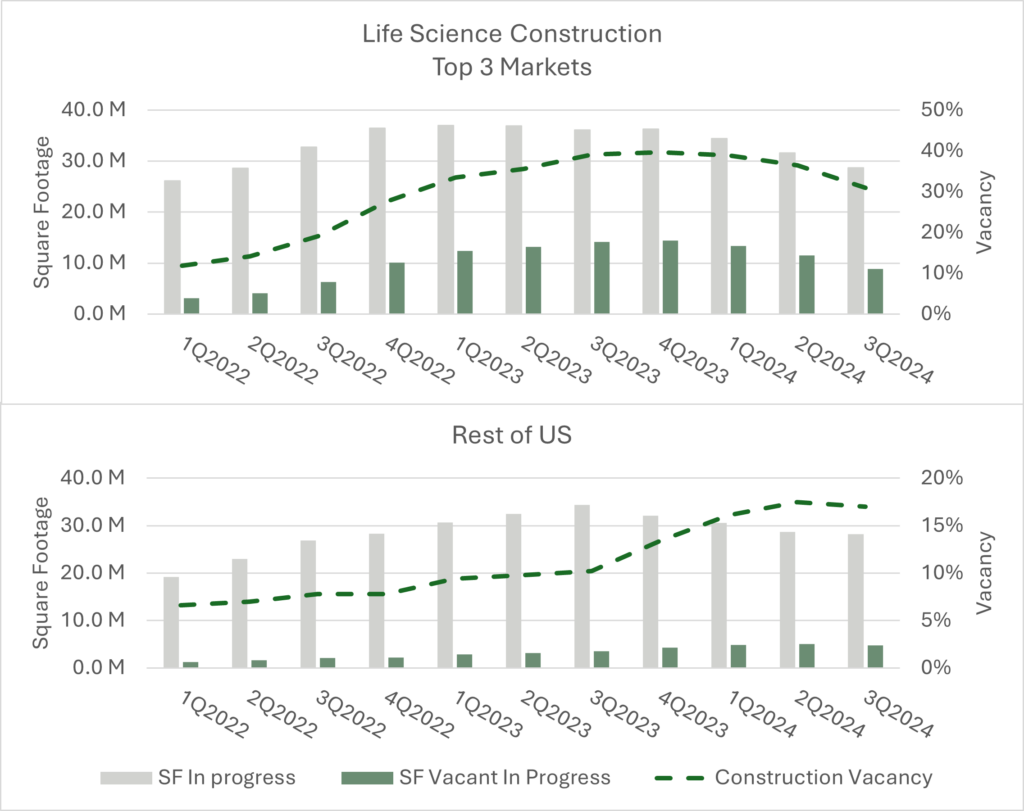
To answer this question, we are going to break up the data into two categories, the top 3 markets (Boston, San Francisco, San Diego) and the rest of the US. We are showing the square footage of construction projects that are in progress, the amount of that construction that is still available to be leased (SF Vacant in Progress) and the vacancy percentage based on those numbers. The top 3 markets had a construction vacancy of 31% in 3Q24. This is down from the peak of 40% we saw in 2023. The overall trend shows a clear increase in speculative development in 2022, a leveling out in 2023, and a downward trend starting in 2024. The pattern is not the same for the markets in the rest of the U.S. Outside the top 3, construction vacancies only rose steadily in 2022, and didn’t go over 10% until 2023. Now the trend is stabilizing at around 17%. Part of the gap between the two sets can be explained by the presence of user-owned buildings. This data contains both investor-owned projects, as well as user-owned developments from pharmaceutical and life science companies. The user-owned projects will typically be fully occupied, and since they take up a larger portion in secondary markets, they tend to push the vacancy levels lower.

